
Financial Word of the Day: MACD (Moving Average Convergence Divergence)
- Larry Jones

- Oct 13, 2025
- 2 min read

Definition of MACD (Moving Average Convergence Divergence)
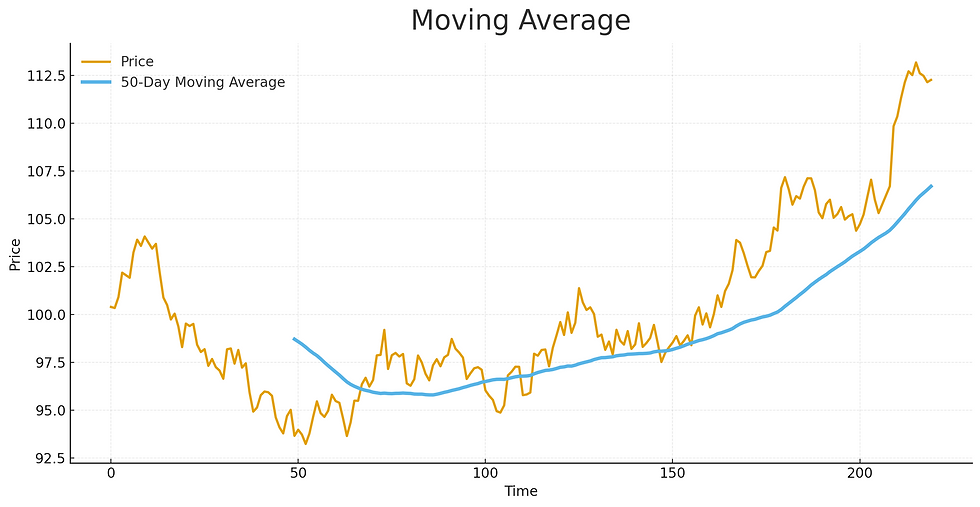
MACD (pronounced “mack-dee”) stands for Moving Average Convergence Divergence. It’s a popular technical indicator used by traders to analyze stock price trends and momentum. In simple terms, it shows the relationship between two moving averages of a stock’s price — usually the 12-day and 26-day exponential moving averages (EMAs).
The MACD line is calculated by subtracting the 26-day EMA from the 12-day EMA. A second line, called the signal line (typically a 9-day EMA of the MACD), is then plotted on top. When the MACD line crosses the signal line, traders often see that as a clue — or “signal” — that momentum is shifting.
Why MACD Matters
The MACD (Moving Average Convergence Divergence) helps investors see what’s not immediately visible in price charts — the momentum behind the movement. Prices might be going up, but is the trend strengthening or slowing down? That’s where MACD comes in.
When the MACD line crosses above the signal line, it often suggests bullish momentum — a potential buy signal.
When the MACD line crosses below the signal line, it indicates bearish momentum — a possible sell signal.
When both lines are above zero, it usually means the trend is strong; when below zero, the trend is weak or reversing.
It’s like watching the tide instead of just the waves — you’re not just seeing motion; you’re seeing direction and strength.

MACD In Real Life
Let’s say you’re tracking Apple (AAPL). You notice the MACD line just crossed above the signal line after a few weeks of decline. That could indicate that buyers are stepping back in, and momentum might be turning upward.
But — and this is crucial — MACD isn’t a magic crystal ball. Like any indicator, it’s best used with other data, not by itself. Many traders combine it with volume indicators, RSI (Relative Strength Index), or moving averages to confirm signals before making a move.
Money Wisdom
Understanding MACD is about learning to “read the room” of the market. Wealthy investors don’t guess — they measure momentum. They look for clues where others see chaos. The middle class often reacts to price moves; the wealthy react to trend strength and timing.
Even if you’re not an active trader, knowing how momentum indicators work sharpens your financial instincts. You’ll start to see that behind every price chart is a story of emotion, behavior, and timing.
Example in a Conversation
“The MACD just flipped positive — looks like the trend’s gaining strength again.”
Translation: The short-term price momentum just turned bullish, suggesting a potential rally or uptrend continuation.
Takeaway
MACD is a momentum meter for the markets. It helps you see when enthusiasm (buying pressure) or exhaustion (selling pressure) is building beneath the surface. Whether you’re an investor or just financially curious, learning to interpret momentum — not just movement — helps you make smarter, more confident money decisions.


Comments